STACK Reports Overview
- Print
- DarkLight
- PDF
STACK Reports Overview
- Print
- DarkLight
- PDF
Article summary
Did you find this summary helpful?
Thank you for your feedback!
Our Reports
STACK has a variety of reports designed to give you your information quickly and easily. STACK also lets you take Snapshots to save data from a certain time and in a certain view for reviewing later.
You can navigate to the Reports tab from within any project using the white navigation bar at the top of the screen.
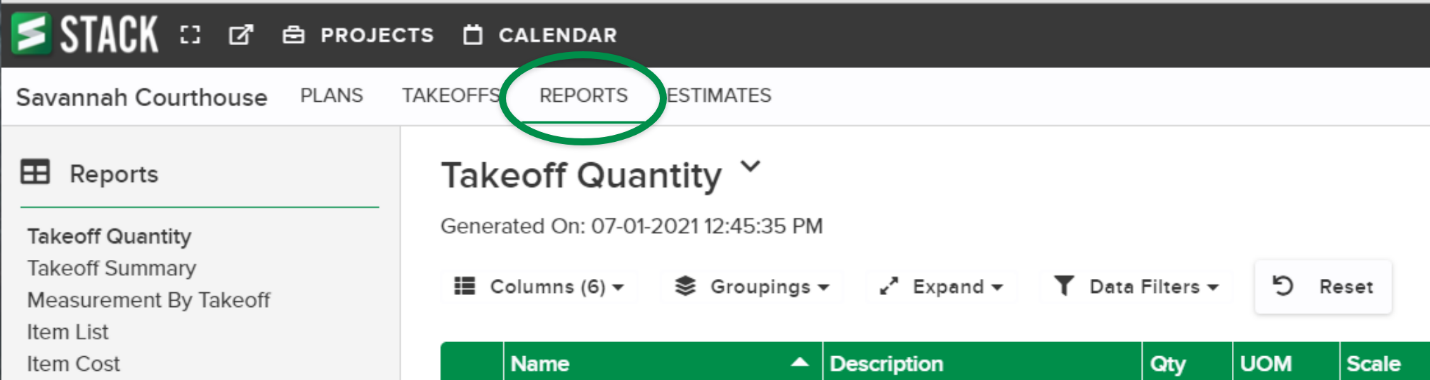
Takeoff Reports
Each report offers a different view of your takeoff data and will reflect your measurement values rounded up to 2 decimal places.
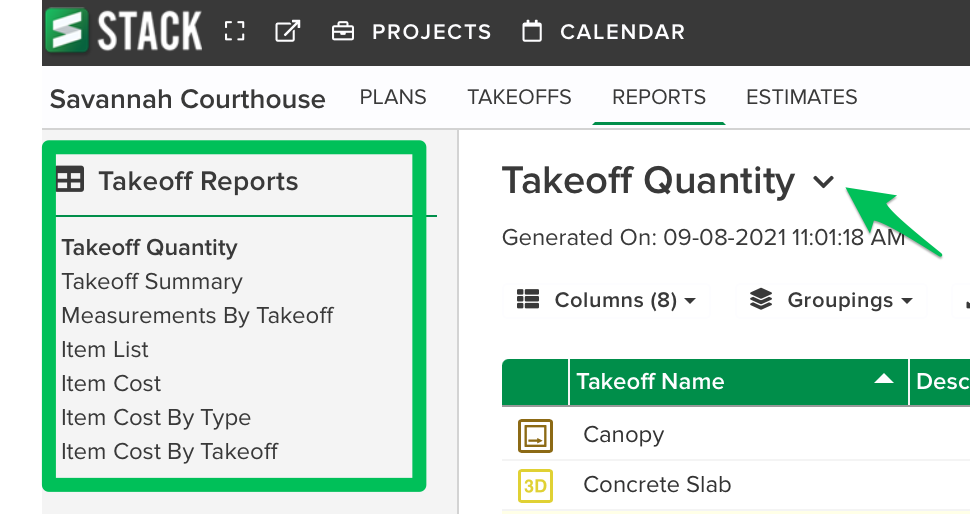
You can select reports with the sidebar on the left side or with the dropdown arrow next to the report name. On mobile devices you can only select reports with the dropdown.
Available Reports
Takeoff Quantity - Report focusing on the primary measurement type.
Takeoff Summary - Report showing the primary measurements, along with any secondary measurements.
Measurement by Takeoff - Report shows each individual geometry for each takeoff. Clicking on the green geometry symbols will redirect you to that specific takeoff and plan sheet. You can use this to quickly check for errors or inconsistencies with labels or scales.
Item List - A material list for the project, without pricing.
Item Cost - A material list for the project, with pricing.
Item Cost by Type - A project-wide report grouped by cost type (which can be managed in company settings). You can use this as a quick reference for all your cost and quantities pertaining to a particular project.
Item Cost by Takeoff - A report showing materials and pricing for each takeoff in the project. You can use this to verify that your items and assemblies are generating the expected quantities.
NOTE: If working within a project, clicking on the Reports tab will direct to the last viewed report.
Estimate Reports
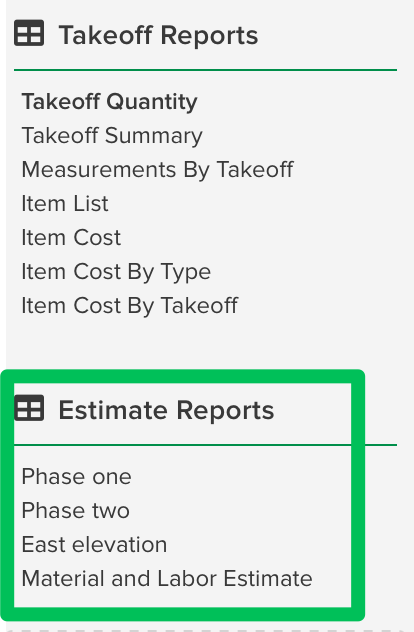
Estimate Reports will automatically appear in the Reports section upon creation of a either a Material and Labor Estimate or Unit Cost Estimate. In the above example, the user created four Material and Labor Estimates and each has a different name (and filtering).
The estimate reports appear with default columns turned on. However, many more columns can be turned on by clicking the column selector (more on this below).
If the estimate is filtered, only the filtered data will appear in the report view. If you wish to view all the data, create another estimate in the project and it will then appear in the reports section.
Create a Snapshot to save the estimate data to today's date and time. This protects the data from being changed if changes are made to the project in the future. You can create multiple Snapshots to save the data at difference stages in the estimate process.
Report functionality and customization
STACK reports are designed to give you great customization with real-time data capturing
Columns - Using the “Columns” dropdown, you can show or hide columns by selecting them from the list. All label group data can be shown as a column, including our default label for plan name.
Columns can also be reordered by clicking and dragging the name of the column left or right.
Columns can be sorted by clicking small triangle icon to sort ascending or descending.
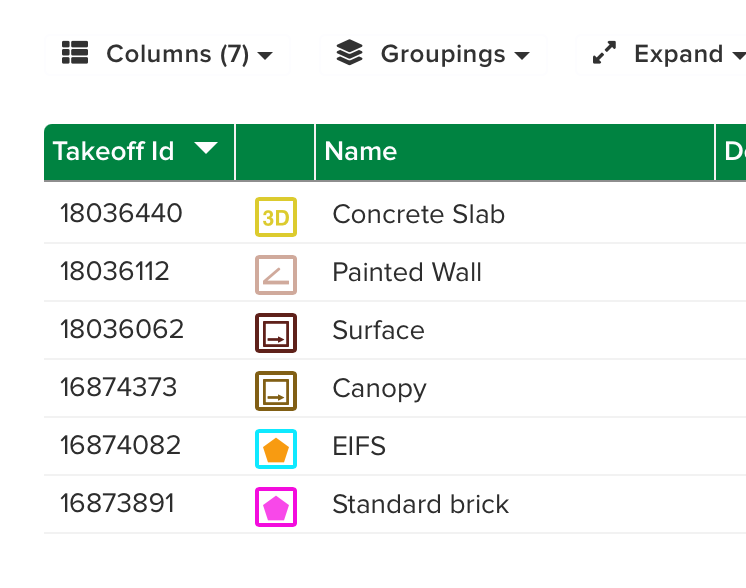
TIP: To sort by creation order, turn on the Takeoff Id column and use the small triangle icon to control the order.
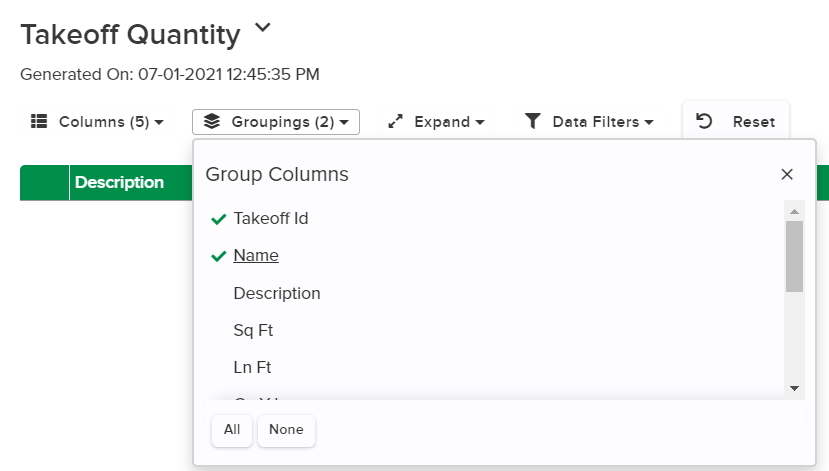
Groupings - Group your takeoff data by labels by putting checkmarks next to the group options. The group order can be controlled by clicking in the order you want the groupings displayed. See related articles below for more on label groups.
TIP: Quickly group by CSI by choosing to group by 'Folder level 2' if using the STACK catalog. Or create your own folder structure in 'My Items' to utilize a categorization method for grouping item and Material and Labor estimate data in the reports area.
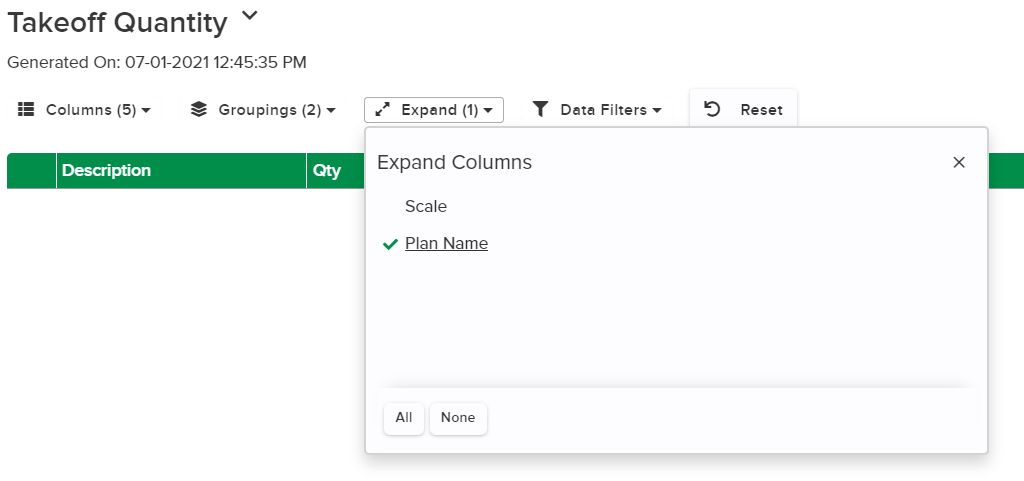
Expand - Expand the data to see an individual row for each data point (e.g. a takeoff that appears on multiple plan sheets will be expanded into separate columns to display values for each sheet).
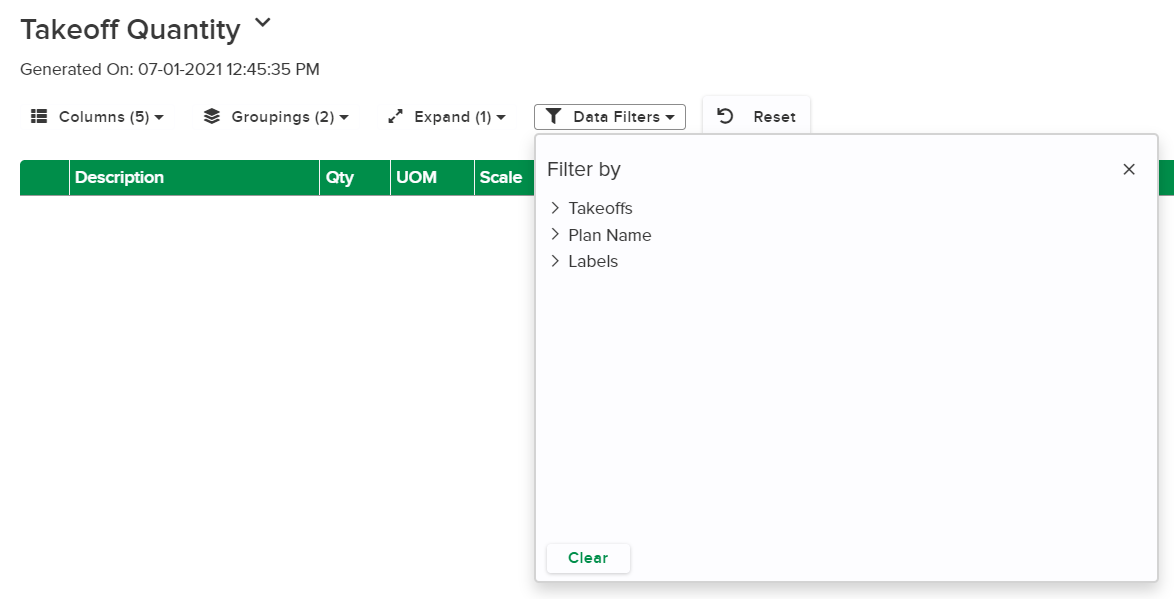
Data Filters - Filter to show/hide data that contain specific values. You can select as many filters as you like which can be based on takeoffs, labels, and cost types (on Item reports only).
STACK reporting also gives you the ability to rearrange, resize, and sort columns.
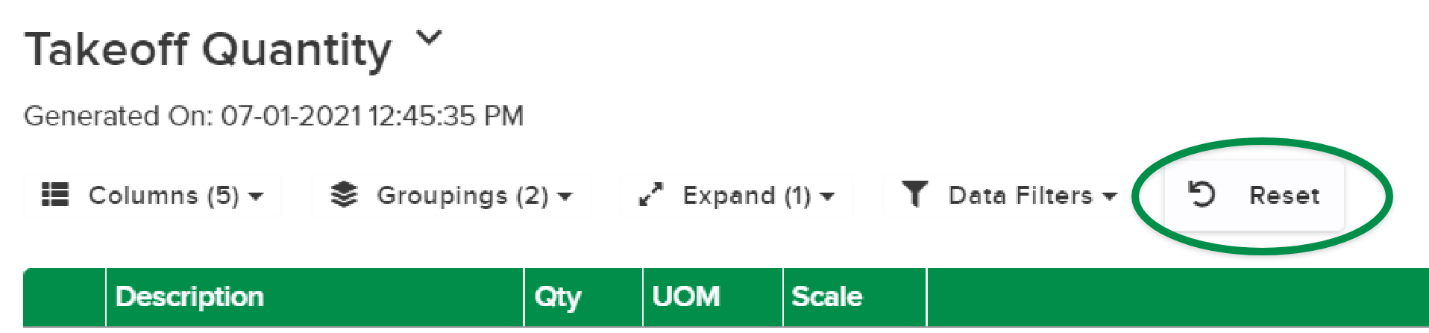
Reset Layout - Reset the report to return to the original, default view.
Options for exporting your report data
Print - We offer a browser print for quick access to unformatted data. For a more professional appearance, we recommend either the Download Landscape or Portrait options.
Export - You can export the data in an Excel format or as a .csv file. The Excel export will generate the data in the same format as you see on your screen. The .csv is a raw unformatted version (good for importing into another system)
Snapshots - Create a snapshot to create an interactive report that saves your grouping and filter information.
How to print or export a report or report snapshot
With the desired report or snapshot in view, select either the print or export drop-downs
The print drop-down provides quick options for a landscape versus portrait print orientation
The excel drop-down lets you decide between an excel, CSV, or project cost calculator export
You can adjust your Printer Settings to accommodate paper size, quality and scale as needed. ** Printer Settings are specific to the user and your specific printer.
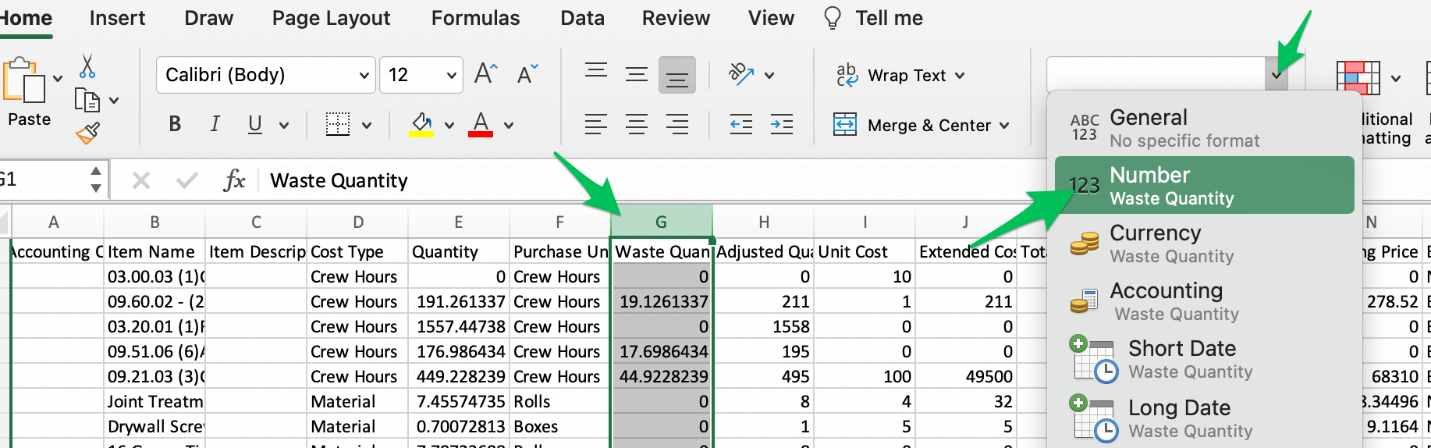
NOTE: Our Excel exports contain detailed precision showing all the digits to the right of the decimal. If you wish to round in Excel to 2 digits, highlight the column(s) and select Number.
Related Articles
Printing Plans and Documents
Using Label Groups
How to Manage Items and Assemblies
Creating and Editing Takeoffs
Set the Scale
Unit Cost Estimate Material and Labor Estimate Overview
Was this article helpful?