Estimate Worksheet Dashboard
- Impression
- SombreLumière
- PDF
Estimate Worksheet Dashboard
- Impression
- SombreLumière
- PDF
The content is currently unavailable in French. You are viewing the default English version.
Résumé de l’article
Avez-vous trouvé ce résumé utile ?
Merci pour vos commentaires
The Estimate Worksheet Dashboard provides a summary of key project information in a standardized format. It displays project size, key unit prices, and estimate totals, allowing estimators to review results and confirm project profitability at a glance. The dashboard also supports comparing results across different estimates with a consistent layout.
Key Information
The Dashboard opens by default when a new Estimate Worksheet is created.
Values shown in the Dashboard are pulled directly from the Estimate Worksheet and update automatically when changes are made.
Project Size must be entered before Key Unit prices can be calculated.
Switch between Worksheet and Dashboard views using the toolbar in the estimates.
Estimate Worksheet Overview
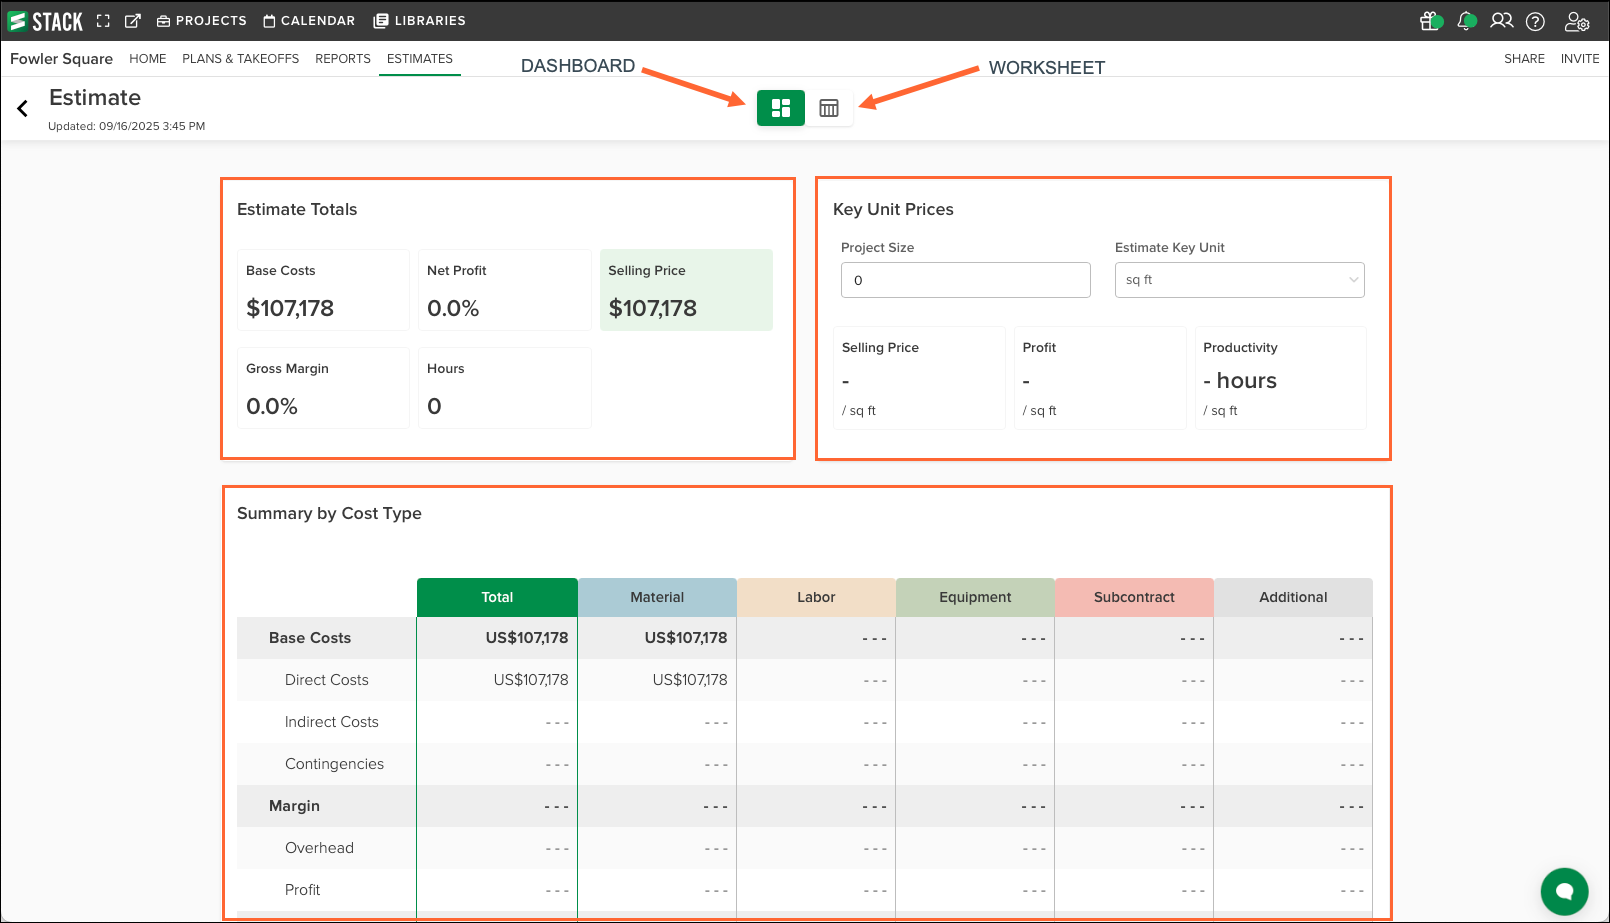
Toggle between the Dashboard and the Worksheet. The Worksheet opens by default when you first click on ESTIMATES in the top navigation menu.
Estimate Totals: The combined values for base costs, net profit percentage, selling price, gross margin percentage, and total labor hours, calculated directly from the Estimate Worksheet.
Key Unit Prices: The selling price, profit, and productivity values displayed per selected unit of measure (such as square feet, linear feet, or cubic yards), calculated once a Project Size is entered.
Summary by Cost Type: A breakdown of costs and margins grouped by category, including base costs (direct, indirect, contingencies) and margin (overhead and profit), with totals displayed for each.
View Estimate Totals
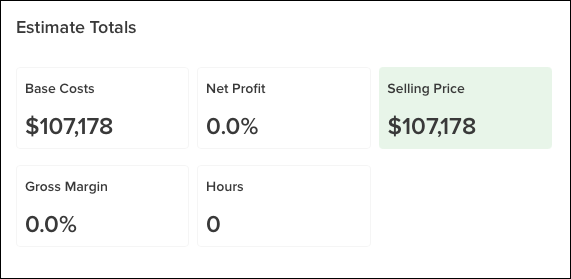
The Estimate Totals section displays:
Base Costs
Net Profit %
Selling Price
Gross Margin %
Hours
All values are calculated directly from the Estimate Worksheet and reflect updates in real time.
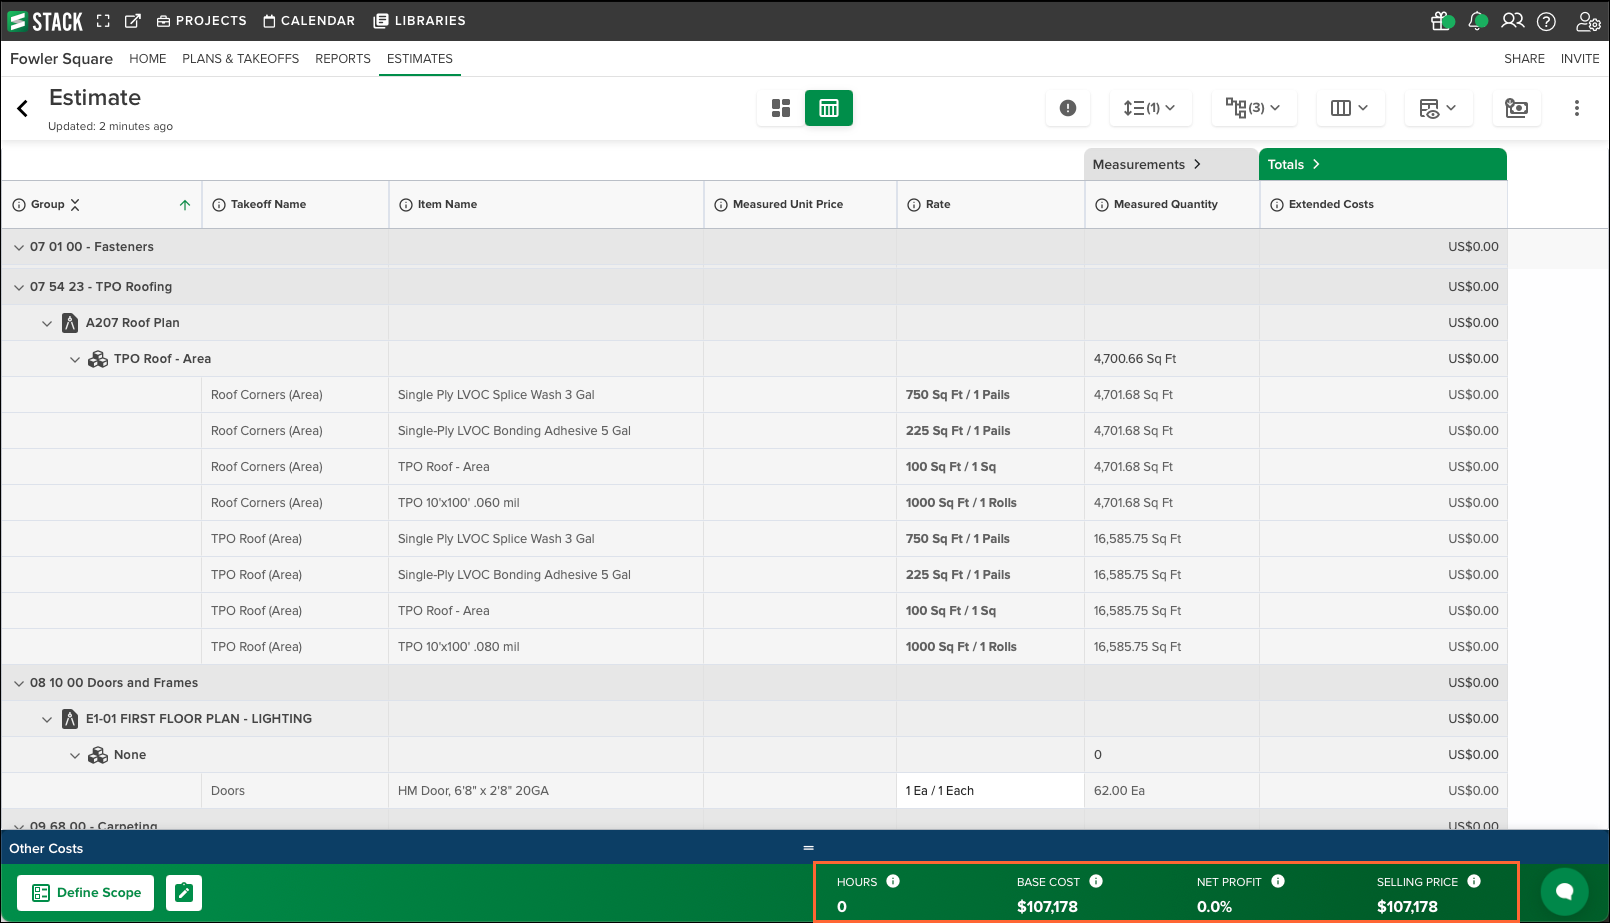
NOTE
The following value match those displayed on the green bar at the bottom of the Estimate Worksheet.
Hours
Represents the total labor hours for the estimate.
Calculated by adding all values in the Hours column of the main estimate grid Totals section.
Base Costs
Represents the combined Direct Costs, Indirect Costs, and Contingencies for the estimate.
Calculated by adding all costs in the Extended Costs, Markup, and Distributed Costs columns of the main estimate grid Totals section, plus all Direct, Indirect, and Contingency costs in the Additional Costs column of the Other Costs section.
Net Profit
Represents the profit percentage relative to the estimate Subtotal.
Subtotal = Base Costs + Margin.
Calculated by dividing the total of all costs assigned the type Profit in the Additional Costs column of the Other Costs section by the Subtotal.
Selling Price
Represents the grand total of the estimate.
Calculated by adding the Base Costs and all Overhead, Profit, and Tax values in the Additional Costs column of the Other Costs section.
Gross Margin
Represents the percentage of margin for the estimate.
Calculated by dividing the Margin Total (Overhead + Profit) by the Subtotal Total from the Summary by Cost Type section of the Dashboard.
Update Key Unit Prices
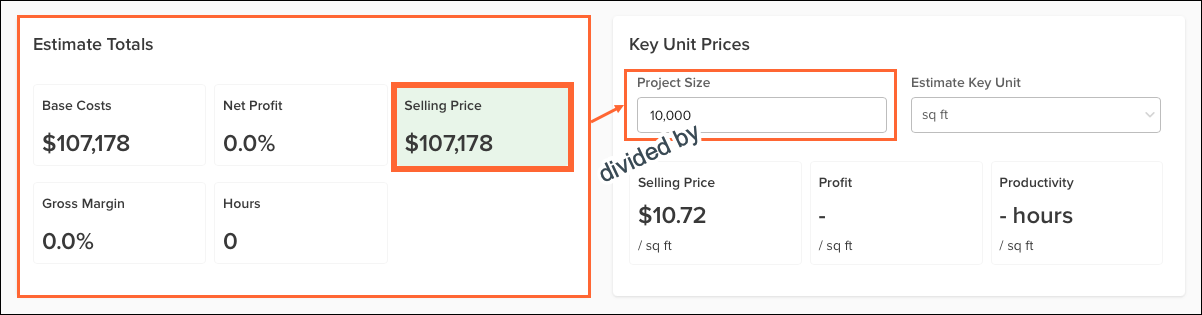
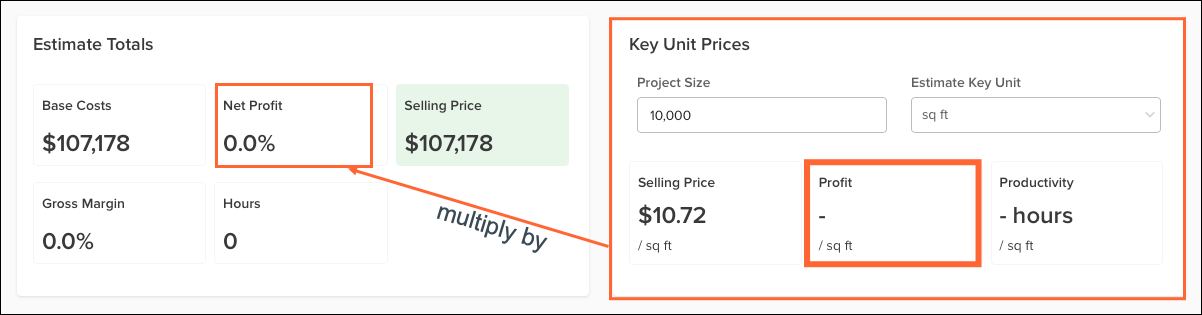
The Key Unit Prices section shows Selling Price, Profit, and Productivity per Key Unit (for example, square feet, linear feet, cubic yards). These values are only calculated after a Project Size has been entered.
Key Unit Prices Calculations
Selling Price: Represents the selling price per Key Unit.
Calculated by dividing the Selling Price from the Estimate Totals section of the Dashboard by the Project Size entered.
Profit: Represents the profit value per Key Unit.
Calculated by multiplying the Key Unit Selling Price by the Net Profit from the Estimate Totals section of the Dashboard.
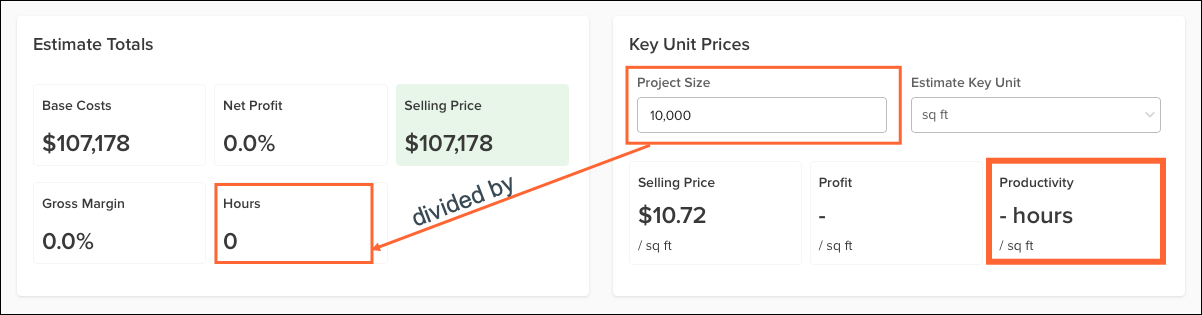
Productivity: Represents the labor hours per Key Unit.
Calculated by dividing the Hours from the Estimate Totals section of the Dashboard by the Project Size entered.
Update the Key Unit
.png)
Enter the Project Size. This value is typically found on the bid invite, but can be a value measured in STACK.
In the Estimate key Unit field, select the desired unit of measure.
NOTE
The default Key Unit is sq ft, but can be changed to cu m, cu yd, each, lin ft, m, or sq m.
The Selling Price, Profit, and Productivity values recalculate automatically.
Review Summary by Cost Type
The Summary by Cost Type section provides a breakdown of costs and margins by category. It includes:
Base Costs (Direct, Indirect, Contingencies)
Margin (Overhead, Profit)
Each column displays totals for Material, Labor, Equipment, Subcontract, and Additional costs, along with the overall total.
Totals are displayed for each cost type, giving a clear overview of how costs and margins are distributed across the estimate.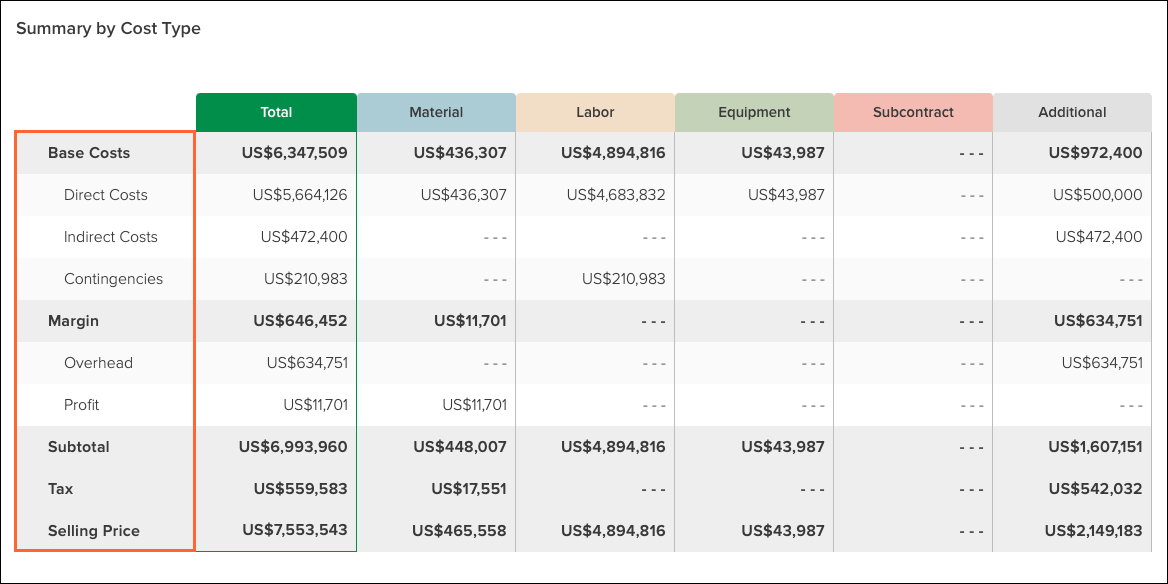
Base Costs
Represents the combined values of Direct Costs, Indirect Costs, and Contingencies.
Calculated from the totals displayed in the Direct Costs, Indirect Costs, and Contingencies rows of each column in this section of the Dashboard.
Direct Costs
Represents the total Extended Costs and Markup for all line items in the Estimate Worksheet, plus all costs assigned the type Direct Costs in the Other Costs section.
Indirect Costs
Represents the total of all costs assigned the type Indirect Costs in the Other Costs section of the Estimate Worksheet.
Contingencies
Represents the total of all costs assigned the type Contingencies in the Other Costs section of the Estimate Worksheet.
Margin
Represents the combined total of Overhead and Profit for each cost category.
Displayed in the Margin row of this section of the Dashboard.
Overhead
Represents the total of all costs assigned the type Overhead in the Other Costs section of the Estimate Worksheet.
Profit
Represents the total of all costs assigned the type Profit in the Other Costs section of the Estimate Worksheet.
Subtotals
Represents the sum of Base Costs and Margin for each cost category and for the overall total.
Tax
Represents the total of all costs assigned the type Tax in the Other Costs section of the Estimate Worksheet.
Selling Price
Represents the overall selling price of the estimate.
This value matches the Selling Price displayed on the green bar at the bottom of the Estimate Worksheet.
For more information and instructions on adding costs to the Other Costs section of the Estimate Worksheet, see Add or Delete Additional Costs from an Estimate Worksheet.
Related Articles
Estimate Worksheet Overview
Add or Delete Additional Costs from an Estimate Worksheet
Cet article vous a-t-il été utile ?